 The developers at Transas Ltd. have been busy since I first reviewed the app in January 2011. The recent release of version 1.5 has updated the iSailor app with a whole new interface for creating and editing Waypoints, Routes and Tracks. The previous versions fell short of giving the user full functionality in creating and editing waypoints and routes. The old interface was one of the reasons I found it cumbersome to use. I am glad to see that they have addressed these issues and are still working to improve the app.
I have always been a big fan of their charts! I find them very bright, colorful and easy to view. The addition of the new features have encourage me to take another look at using the app.
Recently added features
- Multi-layer Waypoint, Route and Track creation and editing
- ETA and XTE data
- Fuel consumption
- Import/export to various format for routes and tracks
- Electronic Bearing Line referenced to a position
- Cursor location tool
- Track recording
- Enter coordinates for waypoint and other points of interest
- Users Guide
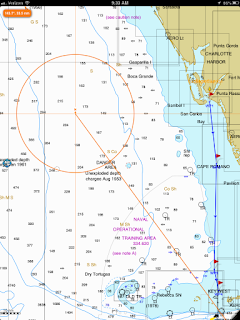
 The new splash screen shows some of the new features that have been added. The three bubbles allow you to move between the different layouts or layers.
The Cross hairs are for the new locator tool. A new point of interest icon is used to add user data to the charts.
The Flag icon is used to create waypoints for routes.
The Arrow icon let you turn on the electronic range and bearing tool.
The Info icon can be tapped to edit and delete route and track details.
This splash screen can be turned off in the settings screen once you get familiar with the new features.
This splash screen can be turned off in the settings screen once you get familiar with the new features.

The locator tool is a neat function that provides multiple functionality. If it is not shown on the screen simply long tap with your finger on any location and you should see the cross hairs appear.
Take your finger and move the center of the cross hair around the screen. The latitude and longitude will appear in an orange bubble in the top left of the screen.
A single tap on the cross hairs will show chart information located at the cross hair location. Tap and hold on the cross hairs to make the tool disappear. A long tap anywhere on the chart displays the locator tool again.
Tap the chart with a second finger while dragging the cross hairs to switch on the electronic Range and Bearing tool. I found it easiest to use my index finger and my thumb As you move the second finger around the cross hairs, note the range and bearing from the cross hairs location shown in the orange bubble on the top left of the screen. Simply long tap the center of the cross hairs to turn it off again.

The three bubbles at the bottom of the screen are hard to find at times. They seem to blend in with the chart data if the chart is lightly colored or busy. The bubbles allow you to select the different layers for creating and editing waypoints, points of interest and routes.
The first bubble only shows the chart and any route that may be selected. The second bubble allows the addition of user points of interest. User points of interest can be added to the chart for your personal reference. The point can be renamed, given a depth and detailed info for rocks obstructions, buoys, beacons or other facilities can be added to the point.
To create a POI, just place your finger on the the POI marker and drag it to the position you want it. As you move it you will see the latitude and longitude in an orange bubble in the upper left of the screen.
Overlayed Waypoint and Course displays are shown on the top of the screen. These show the course and distance along with cross track error and estimated time of arrival. This information is to the first waypoint in the selected route. Location coordinates and course and speed are show in the upper right.

The last layer allows you to add, edit, delete and save routes, waypoint and tracks. If no routes exist you can create one by tapping on the + button in the routes section on the top. To add waypoints to your route, put you finger on the red waypoint flag and drag it onto the chart to create your first waypoint. At this time you can rename the waypoint if desired by tapping the waypoint and typing in the name.
Continue dragging new waypoints onto the chart to create your route. You will notice a handy distance and bearing indication from the previous waypoint as you drag the new waypoint to it's desired position.
Once the route is competed you can select the route or select the italicized i next to the route to see the route info and waypoints. Total route Distance, ETA and fuel consumption are calculated. The cruising speed and fuel consumption can be set hear also.
Tracks can be started and stopped from this layer also. Select the Start Track Recording button to initiate recording. Select it again to stop. Select the italicized i next to the Track to display the start, stop, duration, distance average speed and points of the track. You can delete any of the tracks here also.
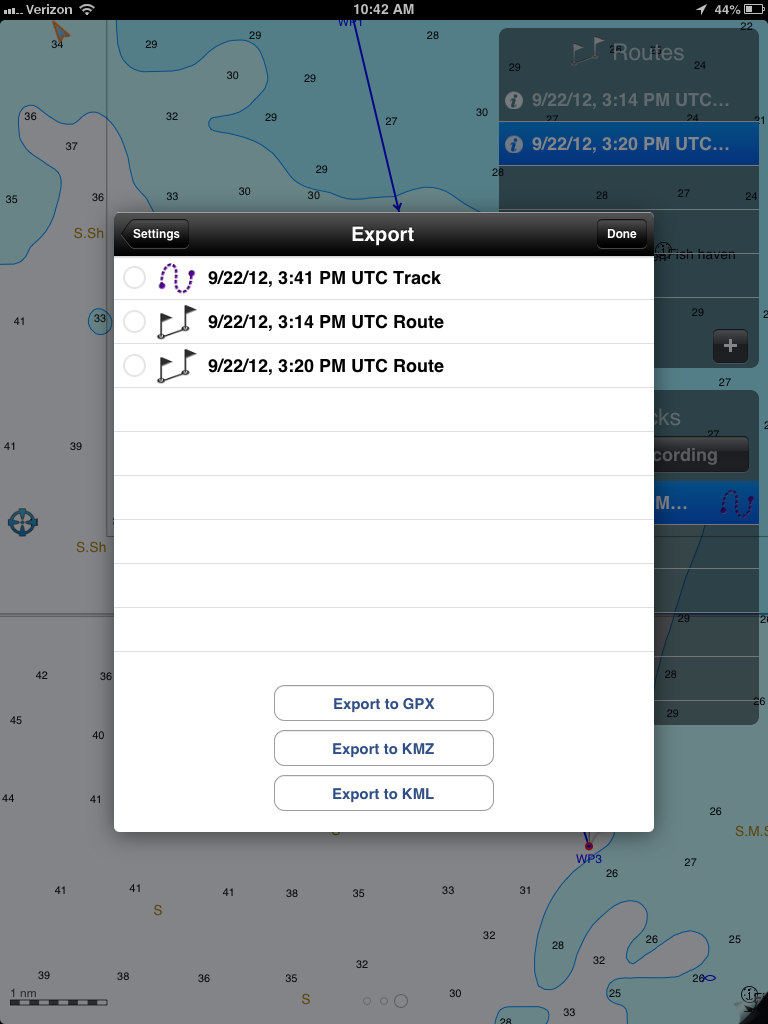
The last feature gives you the ability to export your Routes and Tracks in GPX, KML and KMZ formats.
Simply select the route or track to export and select the file format. The app gives you the ability to save to iTunes, email it or send it to Google Earth, iNavX, Weather 4D, Dropbox or any other compatible app.
I am very impressed with the latest additions to the iSailor App. The additions have improved the user interface immensely and created a more full featured app.
The app is free, yes free! You know how much I like free. The charts are downloaded by in-app purchases ranging from $4.99 to $39.99 depending on which chart package you need.
No comments:
Post a Comment